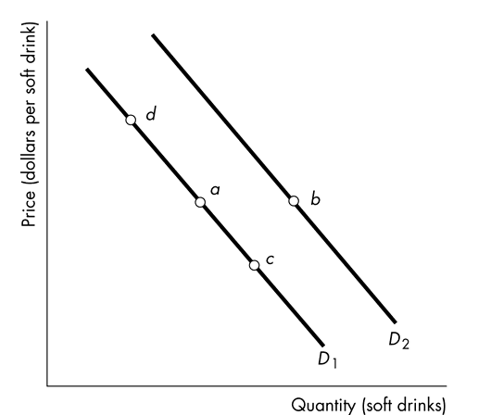
-Consider the demand curves for soft drinks shown in the figure above. A movement from point a
To point b represents
A) an increase in quantity demanded.
B) a decrease in quantity demanded.
C) an increase in demand.
D) a decrease in demand.
Correct Answer:
Verified
Q144: Which of the following is NOT one
Q145: The quantity supplied of a good or
Q146: A supply curve shows the relation between
Q147: The law of demand concludes that a
Q148: Some sales managers are talking shop. Which
Q150: A normal good is one
A) with a
Q151: The quantity of CDs that firms plan
Q152: Because of increasing marginal cost, most supply
Unlock this Answer For Free Now!
View this answer and more for free by performing one of the following actions

Scan the QR code to install the App and get 2 free unlocks

Unlock quizzes for free by uploading documents