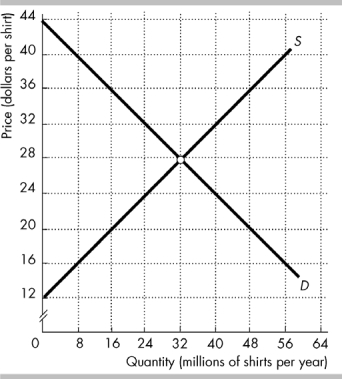
The figure shows the market for shirts in the United States, where D is the domestic demand curve and S is the domestic supply curve. The world price is $20 per shirt.
-In the figure above, with international trade_________ million shirts per year are produced in the United States.
A) 32
B) 48
C) 20
D) 16
Correct Answer:
Verified
Q13: In a market open to international trade,
Q14: Comparative advantage implies that a country will
A)
Q15: The fundamental force that drives international trade
Q16: A country specializes in the production of
Q17: Consider a market that sells some of
Q19: Prior to international trade, if country A
Unlock this Answer For Free Now!
View this answer and more for free by performing one of the following actions

Scan the QR code to install the App and get 2 free unlocks

Unlock quizzes for free by uploading documents