The diagram below shows two budget deficit functions for a hypothetical economy.
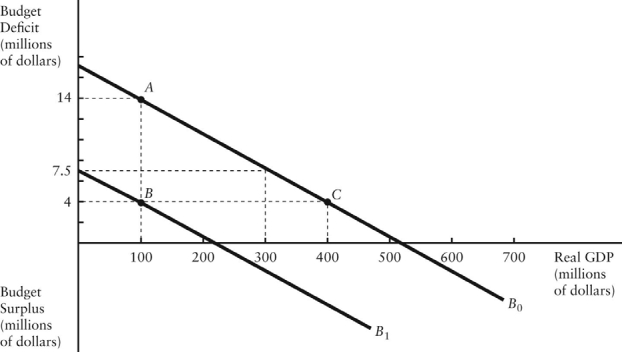 FIGURE 31-2
-Refer to Figure 31-2.Initially,suppose the economy is at point A on budget deficit function B0.Real GDP (Y) is $100 million.If the level of potential output (Y*) were $300 million,the structural budget deficit would be
A) $4 million.
B) $6.5 million.
C) $7.5 million.
D) $14 million.
E) Insufficient information to know.
Correct Answer:
Verified
Q42: The diagram below shows two budget deficit
Q46: The diagram below shows two budget deficit
Q50: The diagram below shows two budget deficit
Q52: The diagram below shows two budget deficit
Q76: The government's structural budget deficit adjusts for
A)any
Q77: The government's structural budget deficit is the
Q89: The concept of "national saving" refers to
Q89: Consider a closed-economy AD/AS macro model.An expansionary
Q93: Consider an open-economy AD/AS macro model.An expansionary
Q94: An illustration of "crowding out" in macroeconomics
Unlock this Answer For Free Now!
View this answer and more for free by performing one of the following actions

Scan the QR code to install the App and get 2 free unlocks

Unlock quizzes for free by uploading documents