The data below provides the Actual and Structural Budget Deficits,as a percentage of real GDP,for Canada between 1999 and 2010.Note that a negative value in the table indicates a budget surplus.
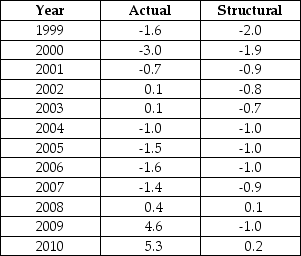 TABLE 31-2
-Refer to Table 31-2.Based on the data in the table,in which of the following years was output greater than potential?
A) 1999
B) 2004
C) 2000
D) 2008
E) 2010
Correct Answer:
Verified
Q61: Consider a government with a positive stock
Q62: The best measure of the change in
Q72: The diagram below shows two budget deficit
Q73: Suppose the real interest rate on government
Q73: The data below provides the Actual and
Q75: Suppose the change in the government's debt-to-GDP
Q78: The diagram below shows two budget deficit
Q79: The data below provides the Actual and
Q80: The diagram below shows two budget deficit
Q89: The concept of "national saving" refers to
Unlock this Answer For Free Now!
View this answer and more for free by performing one of the following actions

Scan the QR code to install the App and get 2 free unlocks

Unlock quizzes for free by uploading documents