The table below shows total output for an economy over 2 years.
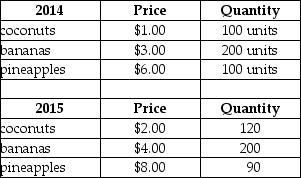 TABLE 20-8
-Refer to Table 20-8.The nominal Gross Domestic Product in 2015 was
A) $1760.
B) $1500.
C) $1300.
D) $1260.
E) $410.
Correct Answer:
Verified
Q41: Which one of the following government expenditures
Q79: The table below includes data for a
Q81: The table below shows total output for
Q82: Suppose that nominal national income in some
Q83: The table below shows total output for
Q85: Real GDP is equivalent to
A)the money value
Q86: The table below shows total output for
Q87: The table below shows total output for
Q88: The table below shows the total output
Q89: The table below shows total output for
Unlock this Answer For Free Now!
View this answer and more for free by performing one of the following actions

Scan the QR code to install the App and get 2 free unlocks

Unlock quizzes for free by uploading documents