The diagram below shows the marginal cost of abatement for each of two firms,A and B.Each firm is initially abating Q 0 units of pollution.
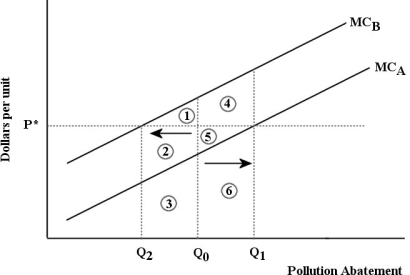 FIGURE 17-7
-Refer to Figure 17-7.Suppose that a system of tradable pollution permits is introduced into this market and the equilibrium permit price is p*.The effect will be that
A) there will be no change in the quantity of abatement by each firm.
B) Firm A will abate less pollution-the amount Q2,and Firm B will abate more pollution-the amount Q1.
C) Firm B will abate less pollution-the amount Q2,and Firm A will abate more pollution-the amount Q1.
D) Firms A and B will each abate Q2 units of pollution.
E) Firms A and B will each abate Q0 units of pollution.
Correct Answer:
Verified
Q104: The diagram below shows a market for
Q109: The diagram below shows the marginal cost
Q115: When comparing a system of emission taxes
Q116: Suppose a competitive market for tradable pollution
Q120: The diagram below shows a market for
Q122: Consider the following equation: Q123: Consider the following equation: Q124: Consider the following equation: Q128: Global greenhouse-gas (GHG)emission reductions are unlikely to Q132: Between 1995 and 2011,Canada's greenhouse gas emissions Unlock this Answer For Free Now! View this answer and more for free by performing one of the following actions Scan the QR code to install the App and get 2 free unlocks Unlock quizzes for free by uploading documents![]()
![]()
![]()

