The diagram below shows a market for tradable pollution permits. 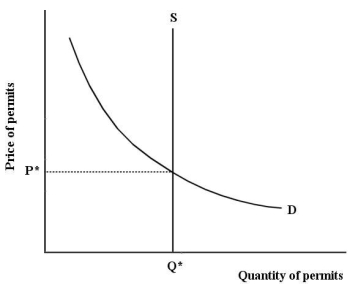 FIGURE 17-8
-Refer to Figure 17-8,which depicts the market for tradable pollution permits.The equilibrium price p*
A) equals the average abatement cost for firms.
B) equals the marginal abatement cost for each profit-maximizing firm.
C) is imposed by the government.
D) is not a function of the abatement technology.
E) is always equal to the subsidy provided by the government.
Correct Answer:
Verified
Q115: One possible strategy for efficiently addressing the
Q116: In a competitive market for tradable pollution
Q117: Suppose a competitive market for tradable pollution
Q118: The diagram below shows the marginal cost
Q119: Consider a coal-fired electric-power plant that is
Q121: When comparing a system of emission taxes
Q122: Consider the following equation: GHG =
Q123: When designing a policy to reduce polluting
Q124: Consider global greenhouse-gas emissions.Suppose that in 2016,greenhouse
Q125: When designing a policy to reduce polluting
Unlock this Answer For Free Now!
View this answer and more for free by performing one of the following actions

Scan the QR code to install the App and get 2 free unlocks

Unlock quizzes for free by uploading documents