The diagram below shows the supply and demand for labour in a hypothetical town in northern British Columbia, with only one employer, a logging company.
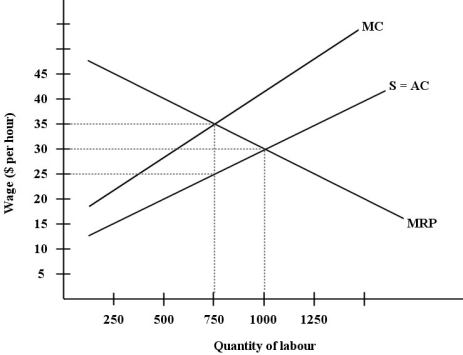 FIGURE 14-4
-Suppose there is a competitive market for retail workers at a large shopping mall that is large enough to constitute its own labour market. The labour demand curve is QD = 1000 - 20w) . The labour supply curve is QS = 400 + 40w) . Suppose that a union now successfully organizes the workers at this mall and obtains a wage rate of $11 but does not affect the demand curve) . The number of workers employed after unionization is
A) 400.
B) 780.
C) 880.
D) 1000.
E) Not determinable from the information provided.
Correct Answer:
Verified
Q62: A legislated minimum wage is comparable to
A)bilateral
Q70: Which of the following statements about a
Q73: A legislated minimum wage is said to
Q74: Suppose there is a competitive market for
Unlock this Answer For Free Now!
View this answer and more for free by performing one of the following actions

Scan the QR code to install the App and get 2 free unlocks

Unlock quizzes for free by uploading documents