The three diagrams below show the supply and demand for teenage babysitters in one local area. The initial supply curve is S 0 in all cases.
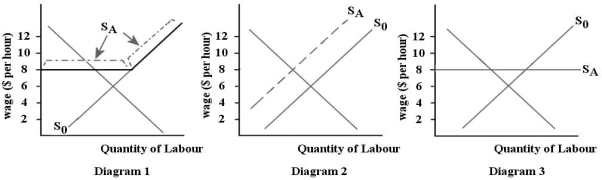 FIGURE 14-3
-Refer to Figure 14-3. Suppose the teenage babysitters in one local area are earning an equilibrium wage of $6 per hour. Now suppose that the local government imposes a minimum wage of $8 per hour for babysitters. Which diagram illustrates the new supply curve SA) for babysitters?
A) diagram 1
B) diagram 2
C) diagram 3
D) none of the diagrams
E) any of the diagrams
Correct Answer:
Verified
Q70: Which of the following statements about a
Q79: The diagram below shows the supply and
Q80: Q83: Economists observe clear evidence of a union Q84: In general,in collective bargaining between a labour Q91: If a union succeeds in shifting the Q92: The fundamental dilemma facing labour unions is Q95: Unions currently represent _ employed workers in Q107: An important unanswered question about the role Q115: One of the most unionized industries in![]()
A)job
Unlock this Answer For Free Now!
View this answer and more for free by performing one of the following actions

Scan the QR code to install the App and get 2 free unlocks

Unlock quizzes for free by uploading documents