 FIGURE 5-6
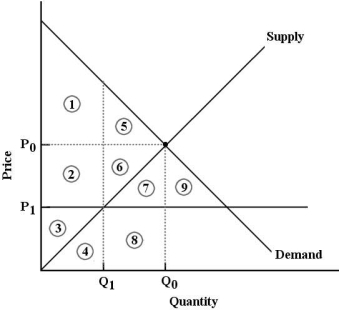
-Refer to Figure 5-6. The market for good X is in equilibrium at P 0 and Q0. Economic surplus is represented by
A) areas 1 and 5.
B) areas 2, 3, 4, 6, 7, 8.
C) areas 1, 2, 3, 5, 6.
D) areas 1, 2, 3, 4, 5, 6, 7, 8.
E) areas 2, 3, 4, 6, 7, 8, 9.
Correct Answer:
Verified
Q72: The diagram below shows the market for
Q73: The diagram below shows the market for
Q102: Suppose a binding output quota is imposed
Q104: In competitive markets,binding price floors and binding
Q108: Output quotas are commonly used in markets
Q113: Which of the following statements most accurately
Q115: One measure of the extent of market
Q117: In general (and in the absence of
Q118: Q120: ![]()
![]()
Unlock this Answer For Free Now!
View this answer and more for free by performing one of the following actions

Scan the QR code to install the App and get 2 free unlocks

Unlock quizzes for free by uploading documents