Use the table below to answer the following questions.
Table 1A.4.2
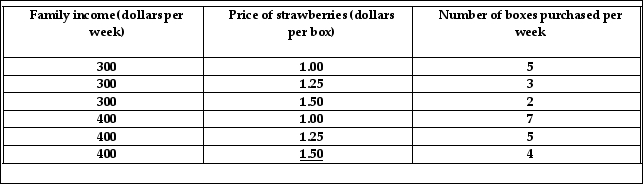

-Given the data in Table 1A.4.2, suppose family income decreases from $400 to $300 per week.Then the graph relating the price of strawberries, measured on the y- axis and the number of boxes of strawberries purchased, measured on the x- axis will
A) become negatively sloped.
B) shift rightward.
C) no longer exist.
D) shift leftward.
E) become positively sloped.
Correct Answer:
Verified
Q155: Q156: Use the table below to answer the Q157: Use the figure below to answer the Q158: Use the figure below to answer the Q159: Consider the following information on cola sales Q161: Use the figure below to answer the Q162: The equation of a line is y Q163: Use the figure below to answer the Q164: The equation of a line is y Q165: The equation of a line is y![]()
Unlock this Answer For Free Now!
View this answer and more for free by performing one of the following actions

Scan the QR code to install the App and get 2 free unlocks

Unlock quizzes for free by uploading documents