Use the figure below to answer the following question.
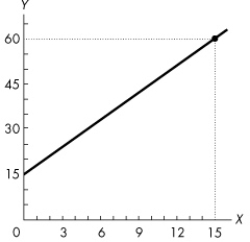 Figure 1A.5.5
-Refer to Figure 1A.5.5.The graph shows the relationship between two variables, x and y.Which of the following equations describes this relationship?
A) y = 3x + 15
B) y = 15x + 3
C) y = - 3x + 15
D) y = - 3x2 + 15
E) x = 15y + 3
Correct Answer:
Verified
Q156: Use the table below to answer the
Q157: Use the figure below to answer the
Q158: Use the figure below to answer the
Q159: Consider the following information on cola sales
Q160: Use the table below to answer the
Q162: The equation of a line is y
Q163: Use the figure below to answer the
Q164: The equation of a line is y
Q165: The equation of a line is y
Q182: If the equation of a straight line
Unlock this Answer For Free Now!
View this answer and more for free by performing one of the following actions

Scan the QR code to install the App and get 2 free unlocks

Unlock quizzes for free by uploading documents