The diagram below shows the domestic demand and supply curves for denim jeans in Canada. The prevailing world price is PW. Assume that all jeans are identical.
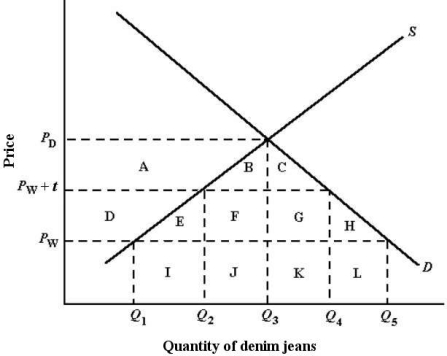 FIGURE 34- 2
-Refer to Figure 34- 2. If Canada imposes a tariff of $t per pair of jeans, the deadweight loss to the Canadian economy is represented by the area
A) D + E + F + G + H.
B) A + B + C.
C) E + H.
D) E + F + G + H.
E) B + C.
Correct Answer:
Verified
Q85: Continued tariff protection for industries that have
Q86: If Canada reduces the tariff imposed on
Q87: If Canada reduces the tariff imposed on
Q88: If a tariff is imposed by a
Q89: The diagram below shows the demand and
Q91: Suppose Canada has a 12- percent tariff
Q92: Suppose you are an economist advising the
Q93: If country A has wages that are
Q94: The diagram below shows the domestic demand
Q95: It is not possible for one country
Unlock this Answer For Free Now!
View this answer and more for free by performing one of the following actions

Scan the QR code to install the App and get 2 free unlocks

Unlock quizzes for free by uploading documents