The diagram below shows the demand and supply curves for refrigerators in Canada.
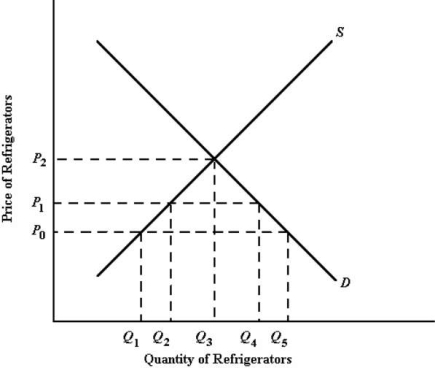 FIGURE 34- 1
-Refer to Figure 34- 1, and assume the world price is P0. The Canadian government now imposes an import quota of the amount Q2Q4. The result would be that the price in Canada would:
A) stay at P0 and consumption would stay at Q5.
B) rise to P1 and consumption would decrease to Q4.
C) rise to P2 and consumption would decrease to Q5.
D) stay at P0 and consumption would rise to Q3.
E) rise to P2 and consumption would decrease to Q4.
Correct Answer:
Verified
Q84: The diagram below shows the domestic demand
Q85: Continued tariff protection for industries that have
Q86: If Canada reduces the tariff imposed on
Q87: If Canada reduces the tariff imposed on
Q88: If a tariff is imposed by a
Q90: The diagram below shows the domestic demand
Q91: Suppose Canada has a 12- percent tariff
Q92: Suppose you are an economist advising the
Q93: If country A has wages that are
Q94: The diagram below shows the domestic demand
Unlock this Answer For Free Now!
View this answer and more for free by performing one of the following actions

Scan the QR code to install the App and get 2 free unlocks

Unlock quizzes for free by uploading documents