Refer to the diagram below. 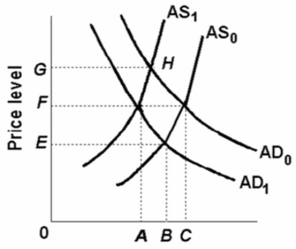 A shift of the aggregate demand curve from AD1 to AD0 might be caused by a(n) :
A) increase in the price level.
B) increase in the price of resources.
C) increase in investment spending.
D) decrease in net export spending.
Correct Answer:
Verified
Q126: The passage of new legislation requiring more
Q140: The following table is for a particular
Q141: Refer to the diagram given below.
Q141: Menu costs will:
A)increase the amount of training
Q142: Refer to the figure given below.
Q143: Refer to the diagram below. 
Q146: Refer to the diagram given below.
Q147: Refer to the diagram given below.
Q149: The following aggregate demand and supply schedules
Q200: Cost-push inflation is characterized by a(n)
A)increase in
Unlock this Answer For Free Now!
View this answer and more for free by performing one of the following actions

Scan the QR code to install the App and get 2 free unlocks

Unlock quizzes for free by uploading documents