Refer to the figure given below. 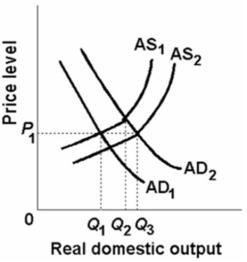 In the above figure, AD1 and AS1 represent the original aggregate demand and aggregate supply curves, respectively.AD2 and AS2 show the new aggregate demand and aggregate supply curves.At the original equilibrium price and quantity, this economy is experiencing:
A) inflation.
B) economic growth.
C) full employment.
D) less than full-capacity output.
Correct Answer:
Verified
Q123: Which would be considered to be one
Q126: The passage of new legislation requiring more
Q138: The following table shows the aggregate demand
Q140: The following table is for a particular
Q141: Refer to the diagram given below.
Q141: Menu costs will:
A)increase the amount of training
Q143: Refer to the diagram below. 
Q144: Refer to the diagram below.
Q146: Refer to the diagram given below.
Q147: Refer to the diagram given below.
Unlock this Answer For Free Now!
View this answer and more for free by performing one of the following actions

Scan the QR code to install the App and get 2 free unlocks

Unlock quizzes for free by uploading documents