 FIGURE 6- 3
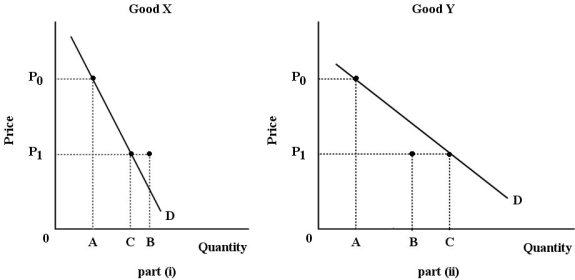
-Refer to Figure 6- 3. For both goods, the price falls from P0 to P1. The substitution effect is illustrated by the change in quantity demanded from A to B; the income effect is illustrated by the change in quantity demanded from B to C. Good Y is certainly a(n) good.
A) luxury
B) normal
C) inferior
D) necessity
E) Giffen
Correct Answer:
Verified
Q14: An indifference curve plotted for two different
Q28: The table below shows the quantities of
Q67: Q68: Assume a person reveals the following demand Q69: Any consumption point that is on the Q70: The figures below show Chris's consumption of Q73: For a product with an income elasticity Unlock this Answer For Free Now! View this answer and more for free by performing one of the following actions Scan the QR code to install the App and get 2 free unlocks Unlock quizzes for free by uploading documents![]()

