The figures below show Chris's consumption of specialty coffee per week. 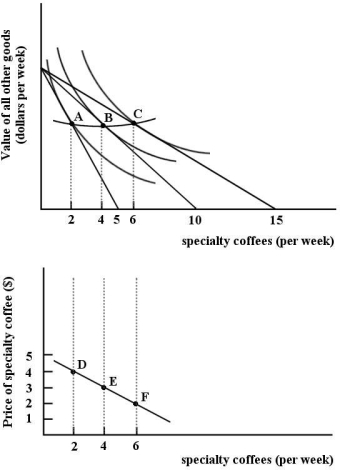 FIGURE 6- 9
-Refer to Figure 6- 9. The two diagrams in Figure 6- 9 are showing
A) that Chris is indifferent between bundles A, B and C.
B) the derivation of Chris's demand curve for specialty coffee.
C) the change in Chris's preferences toward specialty coffee.
D) that Chris is indifferent between points D, E and F.
E) the derivation of Chris's indifference curve for specialty coffee.
Correct Answer:
Verified
Q14: An indifference curve plotted for two different
Q65: The diagram below shows a set of
Q66: Suppose Arun consumes only 2 goods --
Q67: Q68: Assume a person reveals the following demand Q69: Any consumption point that is on the Unlock this Answer For Free Now! View this answer and more for free by performing one of the following actions Scan the QR code to install the App and get 2 free unlocks Unlock quizzes for free by uploading documents![]()

