The diagram below shows the domestic demand and supply curves in the market for newsprint in Paperland. 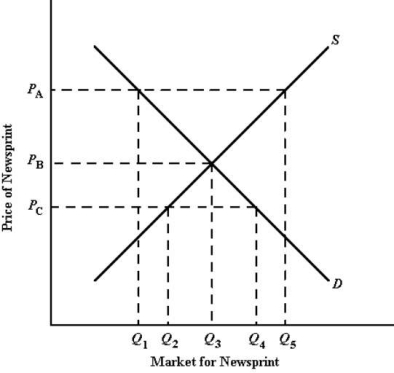 FIGURE 33- 5
-Refer to Figure 33- 5. If Paperland engages in trade and the world price is PB, the residents of Paperland will consume units of newsprint, and the net exports of newsprint from Paperland will be units.
A) Q1; Q5 - Q1
B) Q2; zero
C) Q3; zero
D) Q4; Q5 - Q1
E) Q5; zero
Correct Answer:
Verified
Q7: The diagram below shows the domestic demand
Q17: The "terms of trade" reflect the
A)quantity of
Q29: When specialization according to comparative advantage also
Q33: This table shows how much cotton
Q34: This table shows how much cotton
Q35: The following production possibilities schedule shows
Q39: This table shows how much wine
Q40: The diagram below shows the domestic demand
Q40: The figure below shows Arcticland's annual production
Q41: When opportunity costs are identical between two
Unlock this Answer For Free Now!
View this answer and more for free by performing one of the following actions

Scan the QR code to install the App and get 2 free unlocks

Unlock quizzes for free by uploading documents