The diagram below shows the marginal costs of pollution abatement for two firms, Firm 1 and Firm 2. 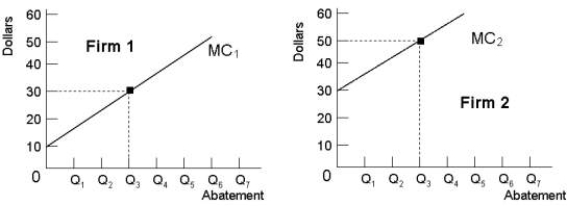 FIGURE 17- 5
-Refer to Figure 17- 5. Suppose Firm 1 and Firm 2 are each abating Q3 units of pollution. If the government imposed an emissions tax of $40 per unit of emissions,
A) each firm would abate to Q3.
B) the level of pollution would be optimal.
C) each firm would abate to the same level.
D) Firm 2 would increase abatement beyond Q3 and Firm 1 would abate less than Q3.
E) Firm 1 would increase abatement beyond Q3 and Firm 2 would abate less than Q3.
Correct Answer:
Verified
Q73: Zero pollution is almost surely NOT a
Q74: Direct pollution controls are usually inefficient because,
Q75: Given that different firms typically have different
Q76: An upward- sloping marginal cost curve for
Q77: When the marginal costs of pollution abatement
Q79: The banning of wood- burning stoves and
Q80: As a method of pollution control, tradable
Q81: The aggregate emission- reduction targets of the
Q82: The figure below shows the marginal benefit
Q83: The diagram below shows the marginal cost
Unlock this Answer For Free Now!
View this answer and more for free by performing one of the following actions

Scan the QR code to install the App and get 2 free unlocks

Unlock quizzes for free by uploading documents