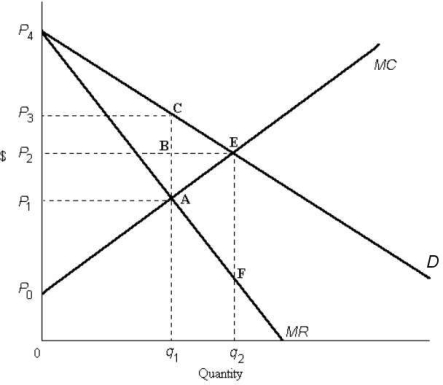
 FIGURE 12- 3
-Refer to Figure 12- 3. The area representing producer surplus at the monopoly equilibrium is outlined by
A) P0P2BA.
B) P0AP1.
C) P2P4E.
D) P0P3CA.
E) 0P0Aq1.
Correct Answer:
Verified
Q7: The diagram below shows the market demand
Q8: Choose the statement that best describes the
Q9: In many cases throughout Canadian history, governments
Q10: Suppose we compare two monopolists with identical
Q11: In general, the sum of consumer and
Q13: For an entire economy, allocative efficiency requires
Q14: Suppose your municipality charges your household a
Q15: The diagram below shows the demand and
Q16: In the absence of market failures, allocative
Q17: Consider a regulated natural monopoly, such as
Unlock this Answer For Free Now!
View this answer and more for free by performing one of the following actions

Scan the QR code to install the App and get 2 free unlocks

Unlock quizzes for free by uploading documents