The diagram below shows the market demand curve and the cost curves for a single firm. 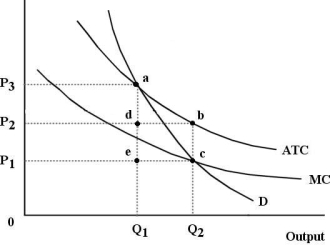 FIGURE 12- 6
-Refer to Figure 12- 6. Suppose the firm is being regulated using a policy of average- cost pricing. The resulting price and output would be
A) P1 and Q2.
B) P3 and Q2.
C) P1 and Q1.
D) P2 and Q2.
E) P3 and Q1.
Correct Answer:
Verified
Q2: If the total output of some industry
Q3: Choose the statement that best compares the
Q4: All points on a country's production possibilities
Q5: Q6: Monopoly is allocatively inefficient because Q8: Choose the statement that best describes the Q9: In many cases throughout Canadian history, governments Q10: Suppose we compare two monopolists with identical Q11: In general, the sum of consumer and Q12: ![]()
A) the price![]()
Unlock this Answer For Free Now!
View this answer and more for free by performing one of the following actions

Scan the QR code to install the App and get 2 free unlocks

Unlock quizzes for free by uploading documents