The diagram below shows the demand and supply curves in a perfectly competitive market. 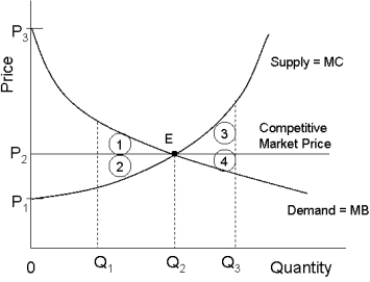 FIGURE 12- 5
-Refer to Figure 12- 5. In the free- market equilibrium, producer surplus is shown by the area
A) P1P2E.
B) 1 +2.
C) 1 + 2 + 3 + 4.
D) P3P2E.
E) P1P3E.
Correct Answer:
Verified
Q82: Q83: In Canada, the Competition Act specifies that Q84: If average- cost pricing is imposed on Q85: According to economist George Stigler, the process Q86: The diagram below shows the demand and Q88: Allocative efficiency occurs when Q89: Consider a natural monopoly that has declining Q90: Consider three firms, A, B and C, Q91: If a regulatory agency imposes a lump- Q92: ![]()
A) the sum of![]()
Unlock this Answer For Free Now!
View this answer and more for free by performing one of the following actions

Scan the QR code to install the App and get 2 free unlocks

Unlock quizzes for free by uploading documents