The diagram below shows the demand and supply curves in a perfectly competitive market. 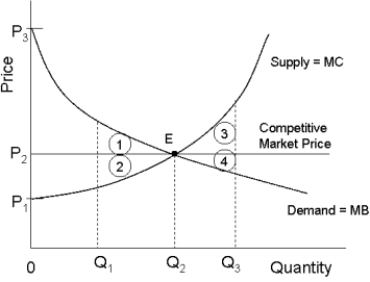 FIGURE 12- 5
-Refer to Figure 12- 5. If output in this market were Q1, but the price was still at its free- market level, the loss in consumer surplus relative to the competitive equilibrium would be illustrated by area
A) P3P2E.
B) 1.
C) 2.
D) P1P3E.
E) 1 + 2.
Correct Answer:
Verified
Q81: An important defence of oligopoly as a
Q82: Q83: In Canada, the Competition Act specifies that Q84: If average- cost pricing is imposed on Q85: According to economist George Stigler, the process Q87: The diagram below shows the demand and Q88: Allocative efficiency occurs when Q89: Consider a natural monopoly that has declining Q90: Consider three firms, A, B and C, Q91: If a regulatory agency imposes a lump-![]()
A) the sum of
Unlock this Answer For Free Now!
View this answer and more for free by performing one of the following actions

Scan the QR code to install the App and get 2 free unlocks

Unlock quizzes for free by uploading documents