Suppose a monopolist faces the demand curve and cost curves shown below. 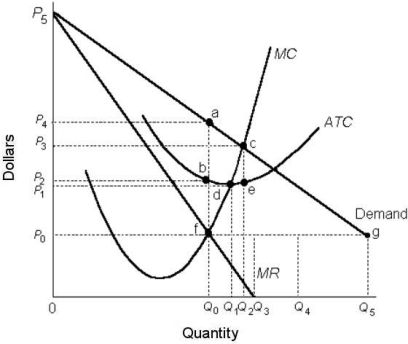 FIGURE 10- 4
-Refer to Figure 10- 4. If the monopolist is practicing perfect price discrimination and is maximizing its profits, the total revenue is represented by the area
A) 0P2bQ0.
B) 0P5cQ2.
C) 0P3cQ2.
D) 0P4aQ0.
E) 0P1dQ1.
Correct Answer:
Verified
Q3: Q8: If a monopolist is practicing perfect price Q9: Which one of the following is a Q11: Suppose a monopolist faces the demand curve Q12: Suppose that a single- price monopolist Q14: Which of the following is probably NOT Q15: Suppose that a single- price monopolist calculates Q16: The diagram below shows total revenue for Q17: The diagram below shows total revenue for Q18: Consider a monopolist that is able to![]()
Unlock this Answer For Free Now!
View this answer and more for free by performing one of the following actions

Scan the QR code to install the App and get 2 free unlocks

Unlock quizzes for free by uploading documents