The diagram below shows total revenue for a single- price monopolist. 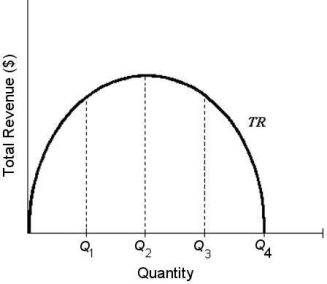 FIGURE 10- 3
-Refer to Figure 10- 3. The firm's marginal revenue at Q1 is
A) negative and falling.
B) zero.
C) positive and rising.
D) positive but falling.
E) not determinable from the diagram.
Correct Answer:
Verified
Q11: Suppose a monopolist faces the demand curve
Q12: Suppose that a single- price monopolist
Q13: Suppose a monopolist faces the demand curve
Q14: Which of the following is probably NOT
Q15: Suppose that a single- price monopolist calculates
Q17: The diagram below shows total revenue for
Q18: Consider a monopolist that is able to
Q19: The cartelization of an industry with a
Q20: A monopolistic firm faces a downward- sloping
Q21: A monopolist is currently producing an output
Unlock this Answer For Free Now!
View this answer and more for free by performing one of the following actions

Scan the QR code to install the App and get 2 free unlocks

Unlock quizzes for free by uploading documents