The figure below shows the demand schedule and demand curve for a product produced by a single- price monopolist. 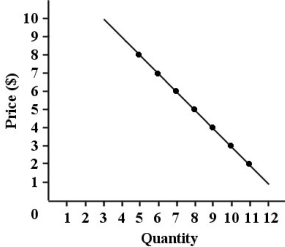 FIGURE 10- 1
-Refer to Figure 10- 1. At what level of output is total revenue maximized for this monopolist?
A) 8 units
B) 11 units
C) 9 units
D) 10 units
E) 7 units
Correct Answer:
Verified
Q34: It is common for a cartel to
Q35: Natural barriers to entry include
A) a patent
Q36: Which of the following products would most
Q38: Your food- services company has been
Q40: The demand curve facing a single- price
Q41: For a single- price monopolist, marginal revenue
Q42: If an industry's demand conditions allow at
Q43: One reason airlines charge a higher price
Q44: The figure below shows the demand
Q51: If a monopolist's marginal revenue is MR
Unlock this Answer For Free Now!
View this answer and more for free by performing one of the following actions

Scan the QR code to install the App and get 2 free unlocks

Unlock quizzes for free by uploading documents