The figure below shows the demand schedule and demand curve for a product produced by a single- price monopolist. 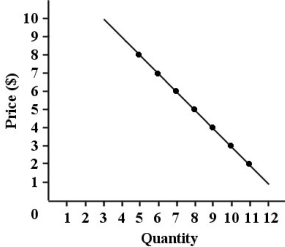 FIGURE 10- 1
-Refer to Figure 10- 1. Suppose this single- price monopolist is initially selling 5 units at $8 each and then reduces the price of the product to $6. By making this change, the firm is giving up revenue of
And gaining revenue of _. Its marginal revenue is therefore . (All figures are dollars.)
A) 10; 12; 2
B) 8; 6; 2
C) 38; 40; 2
D) 5; 7; - 2
E) 14; 14; 0
Correct Answer:
Verified
Q39: The figure below shows the demand
Q40: The demand curve facing a single- price
Q41: For a single- price monopolist, marginal revenue
Q42: If an industry's demand conditions allow at
Q43: One reason airlines charge a higher price
Q45: Which of the following statements about a
Q46: Consider a profit- maximizing single- price monopolist
Q47: One similarity between a monopoly and a
Q48: Your food- services company has been
Q49: The diagram below shows a pharmaceutical firm's
Unlock this Answer For Free Now!
View this answer and more for free by performing one of the following actions

Scan the QR code to install the App and get 2 free unlocks

Unlock quizzes for free by uploading documents