Table 96
Nuts-And-Bolts Inc -The Operations Manager Has Narrowed Down the Search for a for a Plant
Table 9.6
Nuts-and-Bolts Inc. wishes to find the best location for a plant
that will satisfy customer demand in the following five areas.
-The operations manager has narrowed down the search for a new plant to three locations.Fixed and variable costs follow:
Plot the total cost curves in the chart provided below,and identify the range over which each location would be best.Then use break-even analysis to calculate exactly the break-even quantity that defines each range.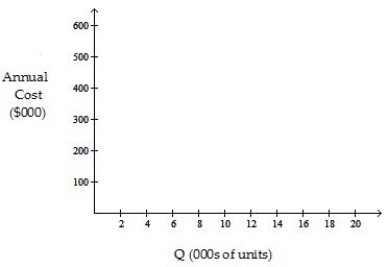
Which of the following statements is correct?
A) Location C is the best one if volumes are quite low.
B) The break-even quantity between B and C is less than or equal to 6000 units.
C) The break-even quantity between A and B is less than or equal to 9170 units.
D) The break-even quantity between A and B is more than 9170 units but less than 9270 units.
Correct Answer:
Verified
Q95: Table 9.8
The Neale Company has four
Q96: Table 9.5
Union Fork, Inc. has five
Q97: Table 9.6
Nuts-and-Bolts Inc. wishes to find
Q98: Table 9.8
The Neale Company has four
Q99: Table 9.5
Union Fork, Inc. has five
Q101: Which of the following statements about performance
Q102: Which one of the following statements is
Q103: Which of the following definitions on layout
Q104: Table 9.10
A firm of four departments
Q105: A company that assembles big airplanes or
Unlock this Answer For Free Now!
View this answer and more for free by performing one of the following actions

Scan the QR code to install the App and get 2 free unlocks

Unlock quizzes for free by uploading documents