Table 96
Nuts-And-Bolts Inc -Excel Products Is Planning a New Warehouse to Serve the for a Plant
Table 9.6
Nuts-and-Bolts Inc. wishes to find the best location for a plant
that will satisfy customer demand in the following five areas.
-Excel Products is planning a new warehouse to serve the Southeast.Locations A,B,and C are under consideration.Fixed and variable costs follow:
Plot the total cost curves in the chart provided below,and identify the range over which each location would be best.Then use break-even analysis as necessary to calculate exactly the break-even quantity that defines each range.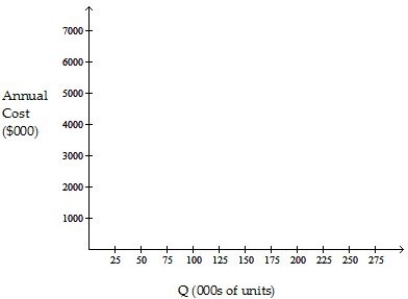
Which of the following statements is correct?
A) Location A is the best one if volumes are quite high.
B) Location B is best over all volume levels.
C) The total cost of location A, if the volume is 250,000 units, is over $7,000,000.
D) The break-even quantity between A and B is more than 75,000 units but less than 200,000 units.
Correct Answer:
Verified
Q92: Table 9.6
Nuts-and-Bolts Inc. wishes to find
Q93: Bill Burns,district manager of the Pizza
Q94: Table 9.5
Union Fork, Inc. has five
Q95: Table 9.8
The Neale Company has four
Q96: Table 9.5
Union Fork, Inc. has five
Q98: Table 9.8
The Neale Company has four
Q99: Table 9.5
Union Fork, Inc. has five
Q100: Table 9.6
Nuts-and-Bolts Inc. wishes to find
Q101: Which of the following statements about performance
Q102: Which one of the following statements is
Unlock this Answer For Free Now!
View this answer and more for free by performing one of the following actions

Scan the QR code to install the App and get 2 free unlocks

Unlock quizzes for free by uploading documents