According to the data presented in the graph, between 1960 and 2000, CO2 levels rose approximately ________ ppm. 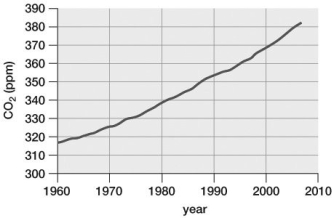
A) 320
B) 20
C) 50
D) 70
E) 370
Correct Answer:
Verified
Q102: Plants produce biomass by taking in energy,
Q106: What would happen if there were no
Q107: On a field trip with your class
Q115: Why is phosphorus so important to living
Q117: A rancher begins raising sheep on the
Q119: Sulfur dioxide is a natural product of
Q121: This graph, based on IPCC estimates, predicts
Q122: In an attempt to become more environmentally
Q123: As part of a research project, a
Q124: The graph indicates that since 1960, global
Unlock this Answer For Free Now!
View this answer and more for free by performing one of the following actions

Scan the QR code to install the App and get 2 free unlocks

Unlock quizzes for free by uploading documents