The following graphic of residential housing data (selling price and size in square feet) indicates _____________. 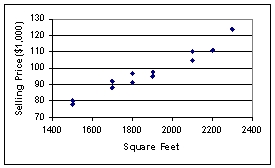
A) an inverse relation between the two variables
B) no relation between the two variables
C) a direct relation between the two variables
D) a negative exponential relation between the two variables
E) a sinusoidal relationship between the two variables
Correct Answer:
Verified
Q86: According to the following graphic, "Bent Pins"
Q87: The customer help center in your company
Q88: In a frequency distribution, the first class
Q89: The following pie chart shows the market
Q90: Your company is doing market research to
Q92: Scott Brim, Chief Financial Officer of
Q93: In a frequency distribution, the first class
Q94: The staff of Ms.Tamara Hill, VP of
Q95: According to the following graphic, the most
Q96: The following graphic of residential housing data
Unlock this Answer For Free Now!
View this answer and more for free by performing one of the following actions

Scan the QR code to install the App and get 2 free unlocks

Unlock quizzes for free by uploading documents