The following graphic of residential housing data (selling price and size in square feet) is a _____________. 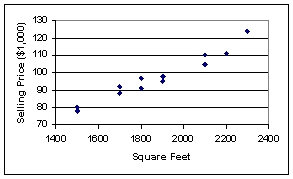
A) scatter plot
B) Pareto chart
C) pie chart
D) cumulative histogram
E) cumulative frequency distribuion
Correct Answer:
Verified
Q91: The following graphic of residential housing data
Q92: Scott Brim, Chief Financial Officer of
Q93: In a frequency distribution, the first class
Q94: The staff of Ms.Tamara Hill, VP of
Q95: According to the following graphic, the most
Q97: Consider a scatterplot showing the relationship between
Q98: The class mark is the _, and
Q99: A retail shoe company would like to
Q100: The following graphic of PCB Failures is
Q101: A shirt production company has tracked their
Unlock this Answer For Free Now!
View this answer and more for free by performing one of the following actions

Scan the QR code to install the App and get 2 free unlocks

Unlock quizzes for free by uploading documents