The following graphic of PCB Failures is a _____________. 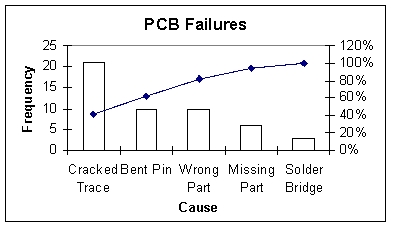
A) Scatter Plot
B) Pareto Chart
C) Pie Chart
D) Cumulative Histogram Chart
E) Line diagram
Correct Answer:
Verified
Q95: According to the following graphic, the most
Q96: The following graphic of residential housing data
Q97: Consider a scatterplot showing the relationship between
Q98: The class mark is the _, and
Q99: A retail shoe company would like to
Q101: A shirt production company has tracked their
Q102: The following time-series data shows the
Q103: The following time-series data shows the
Q104: To show hourly sales throughout a day,
Q105: A shirt production company has tracked their
Unlock this Answer For Free Now!
View this answer and more for free by performing one of the following actions

Scan the QR code to install the App and get 2 free unlocks

Unlock quizzes for free by uploading documents