A shirt production company has tracked their production and expenses since the company started in 1999.The graph of both is shown. 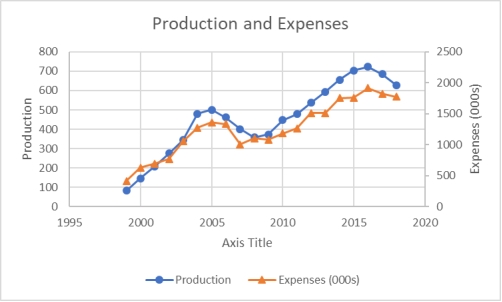 When comparing production and expenses during these years, what conclusion is not true?
A) Both series are generally decreasing.
B) Both series are generally increasing.
C) The time from 2005 to 2008 indicates a downward trend for both
D) The time from 2008 to 2018 indicates an upward trend for both
E) Expenses and production appear to follow similar trends
Correct Answer:
Verified
Q100: The following graphic of PCB Failures is
Q101: A shirt production company has tracked their
Q102: The following time-series data shows the
Q103: The following time-series data shows the
Q104: To show hourly sales throughout a day,
Q106: Monthly sales were tracked and shown on
Q107: A shirt production company has tracked their
Q108: A shirt production company has tracked their
Q109: Sales are tracked during the past year
Q110: Monthly sales were tracked and shown on
Unlock this Answer For Free Now!
View this answer and more for free by performing one of the following actions

Scan the QR code to install the App and get 2 free unlocks

Unlock quizzes for free by uploading documents