A shirt production company has tracked their production since the company started in 1999.The graph of their annual production is shown. 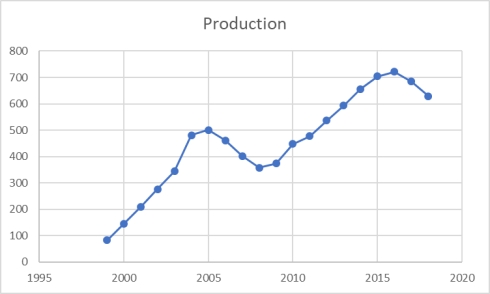 During these years, production has generally _______________.
A) increased in these years.
B) declined in most of the years shown.
C) increased in every year since 1999.
D) decreased in most of those years.
E) increased and declined without a discernable trend.
Correct Answer:
Verified
Q103: The following time-series data shows the
Q104: To show hourly sales throughout a day,
Q105: A shirt production company has tracked their
Q106: Monthly sales were tracked and shown on
Q107: A shirt production company has tracked their
Q109: Sales are tracked during the past year
Q110: Monthly sales were tracked and shown on
Q111: A shirt production company has tracked their
Q112: Sales are tracked during the past year
Q113: A shirt production company has tracked their
Unlock this Answer For Free Now!
View this answer and more for free by performing one of the following actions

Scan the QR code to install the App and get 2 free unlocks

Unlock quizzes for free by uploading documents