Sales are tracked during the past year in the graph below. 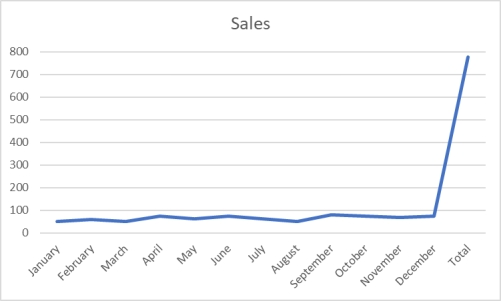 What would be the most effective strategy to allow management to more clearly discern monthly trends in sales?
A) Remove the total value from being included in the graph.
B) Have the axis on the left show more detailed grid lines between 0 and 100
C) Show the trend line in a more vivid color.
D) Add labels to each of the graphed data points.
E) Add minor grid lines throughout the graph making values more clear.
Correct Answer:
Verified
Q103: The following time-series data shows the
Q104: To show hourly sales throughout a day,
Q105: A shirt production company has tracked their
Q106: Monthly sales were tracked and shown on
Q107: A shirt production company has tracked their
Q108: A shirt production company has tracked their
Q110: Monthly sales were tracked and shown on
Q111: A shirt production company has tracked their
Q112: Sales are tracked during the past year
Q113: A shirt production company has tracked their
Unlock this Answer For Free Now!
View this answer and more for free by performing one of the following actions

Scan the QR code to install the App and get 2 free unlocks

Unlock quizzes for free by uploading documents