Which acid-base combination is depicted by this titration curve? The dot on the curve is located at the titrant volume where the titration solution pH equals 7. 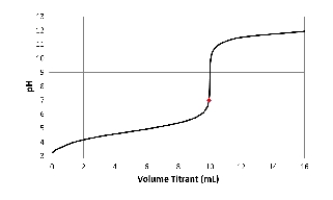
A) Titration of a strong acid with a strong base.
B) Titration of a strong base with a strong acid.
C) Titration of a weak acid with a strong base.
D) Titration of a weak base with a strong acid.
E) Not enough information provided.
Correct Answer:
Verified
Q21: How many moles of solid NaF would
Q22: What molar ratio of acetic acid to
Q28: A 50.0 mL sample of 0.155 M
Q30: What mass of solid NaCH3CO2 (molar mass
Q40: What is the pH at the equivalence
Q43: The concentration of calcium carbonate in
Q47: The Ksp of Ca(OH)2 is 5.5 ×
Q51: A 25.00-mL sample of propionic acid,HC3H5O2,of unknown
Q55: The solubility of manganese(II)carbonate is 5.4 ×
Q121: Which of the following indicators is most
Unlock this Answer For Free Now!
View this answer and more for free by performing one of the following actions

Scan the QR code to install the App and get 2 free unlocks

Unlock quizzes for free by uploading documents