Refer to the graph shown. Between points B and D, marginal utility is: 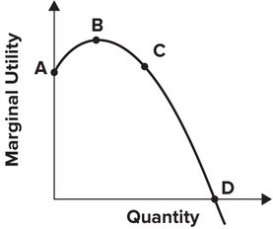
A) increasing, and so total utility is falling.
B) positive, and so total utility is increasing.
C) positive, and so total utility is falling.
D) increasing, and so total utility is at its maximum.
Correct Answer:
Verified
Q33: Refer to the graph shown. Total utility
Q34: As long as total utility is increasing,
Q35: The following table lists the utility
Q36: Suppose one Big Mac gives you a
Q37: Refer to the following graph. 
Q39: Refer to the following figure.
Q40: Refer to the following graph.
Q41: The principle of diminishing marginal utility states
Q42: The principle of diminishing marginal utility states
Q43: You're maximizing utility when:
A) (MU of X)/
Unlock this Answer For Free Now!
View this answer and more for free by performing one of the following actions

Scan the QR code to install the App and get 2 free unlocks

Unlock quizzes for free by uploading documents