Refer to the following figure. 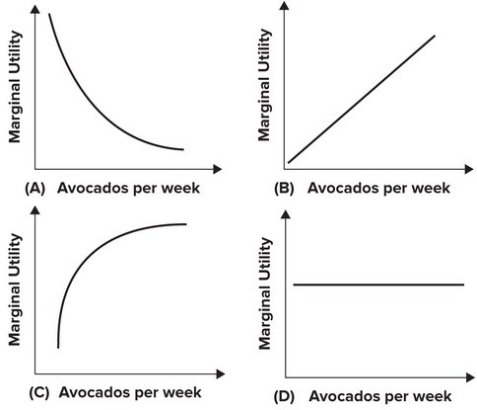 Geri likes avocados; each additional avocado she consumes adds as much to her total utility as did the previous one. Which of the four graphs best represents Geri's marginal utility curve for avocados?
A) A
B) B
C) C
D) D
Correct Answer:
Verified
Q34: As long as total utility is increasing,
Q35: The following table lists the utility
Q36: Suppose one Big Mac gives you a
Q37: Refer to the following graph. 
Q38: Refer to the graph shown. Between points
Q40: Refer to the following graph.
Q41: The principle of diminishing marginal utility states
Q42: The principle of diminishing marginal utility states
Q43: You're maximizing utility when:
A) (MU of X)/
Q44: The principle of diminishing marginal utility says
Unlock this Answer For Free Now!
View this answer and more for free by performing one of the following actions

Scan the QR code to install the App and get 2 free unlocks

Unlock quizzes for free by uploading documents