Refer to the graph shown. Areas C and D represent: 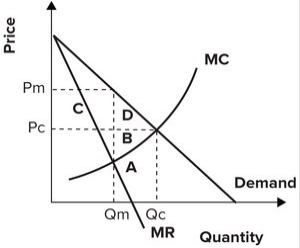
A) the loss of surplus by consumers resulting from a monopoly.
B) the cost to society of increasing output from Qm to Qc.
C) consumer surplus redistributed to the monopolist.
D) the loss of surplus by producers resulting from a monopoly.
Correct Answer:
Verified
Q72: Refer to the graph shown. Assuming that
Q73: Refer to the graph shown. If hamburgers
Q74: Refer to the graph shown. Suppose the
Q75: Refer to the graph shown. Area B
Q76: Refer to the graph shown. If hamburgers
Q78: The deadweight loss from monopoly exists because:
A)
Q79: Refer to the graph shown. If a
Q80: Refer to the graph shown. If hamburgers
Q81: Dynamic pricing allows a website to use
Q82: Refer to the graph shown. If the
Unlock this Answer For Free Now!
View this answer and more for free by performing one of the following actions

Scan the QR code to install the App and get 2 free unlocks

Unlock quizzes for free by uploading documents