The following graph shows average fixed costs, average variable costs, average total costs, and marginal costs of production. 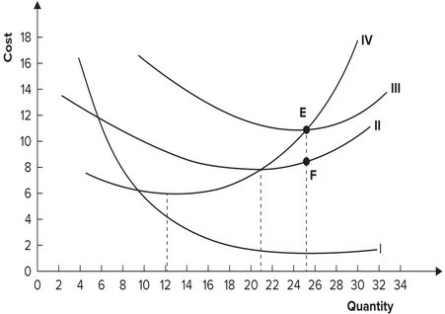 The distance EF represents:
A) average variable cost.
B) average total cost.
C) average fixed cost.
D) marginal cost.
Correct Answer:
Verified
Q96: When output is 50, fixed costs are
Q97: In the short run, average variable cost
Q98: Refer to the table shown. If
Q99: If fixed costs equal $120, variable costs
Q100: When output is 500, a firm's fixed
Q102: Refer to the table shown. The
Q103: Refer to the table shown. The
Q104: The average fixed cost curve is:
A) U-shaped.
B)
Q105: If a firm's average fixed cost is
Q106: The following graph shows average fixed costs,
Unlock this Answer For Free Now!
View this answer and more for free by performing one of the following actions

Scan the QR code to install the App and get 2 free unlocks

Unlock quizzes for free by uploading documents