Refer to the graph shown. Assume the market is initially in equilibrium at point b in the graph but the imposition of a per-unit tax on this product shifts the supply curve up from S0 to S1. The effect of the tax is to raise equilibrium price from: 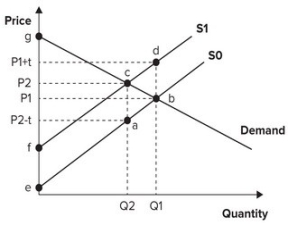
A) P1 to P1 + t.
B) P1 to P2.
C) P2 − t to P2.
D) P2 − t to P1 + t.
Correct Answer:
Verified
Q36: Refer to the graph shown. If the
Q37: Refer to the graph shown. When the
Q38: Refer to the graph shown. When the
Q39: Refer to the graph shown. If the
Q40: Refer to the graph shown. If consumers
Q42: Refer to the graph shown. Assume that
Q43: Refer to the graph shown. Assume that
Q44: Refer to the graph shown. Assume the
Q45: Refer to the graph shown. Assume the
Q46: Refer to the graph shown. Assume that
Unlock this Answer For Free Now!
View this answer and more for free by performing one of the following actions

Scan the QR code to install the App and get 2 free unlocks

Unlock quizzes for free by uploading documents