Refer to the graph shown. Assume the market is initially in equilibrium at point b in the graph but the imposition of a per-unit tax on this product shifts the supply curve up from S0 to S1. The amount of revenue government will collect from this tax is equal to the: 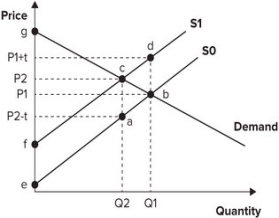
A) amount of the per-unit tax multiplied by Q1.
B) amount of the per-unit tax multiplied by Q2.
C) area of the triangle abc.
D) area of the triangle bcd.
Correct Answer:
Verified
Q40: Refer to the graph shown. If consumers
Q41: Refer to the graph shown. Assume the
Q42: Refer to the graph shown. Assume that
Q43: Refer to the graph shown. Assume that
Q44: Refer to the graph shown. Assume the
Q46: Refer to the graph shown. Assume that
Q47: Refer to the graph shown. Assume that
Q48: Refer to the graph shown. Assume that
Q49: Refer to the graph shown. Assume that
Q50: A per-unit tax will result in a
Unlock this Answer For Free Now!
View this answer and more for free by performing one of the following actions

Scan the QR code to install the App and get 2 free unlocks

Unlock quizzes for free by uploading documents