Refer to the graph shown. Assume the market is initially in equilibrium at point j in the graph but the imposition of a per-unit tax on this product shifts the supply curve up from S0 to S1. The amount of revenue the government will collect from this tax is equal to the area of: 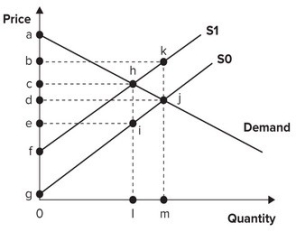
A) rectangle chie.
B) triangle ach.
C) triangle egi.
D) rectangle bkjd.
Correct Answer:
Verified
Q64: Refer to the graph shown. Initially, the
Q65: Refer to the graph shown. Assume the
Q66: Refer to the graph shown. Initially, the
Q67: Refer to the graph shown. Assume the
Q68: Refer to the graph shown. Assume the
Q70: Refer to the graph shown. Assume that
Q71: Refer to the graph shown. Assume the
Q72: If the supply curve is perfectly inelastic,
Q73: Refer to the graph shown. Initially, the
Q74: Refer to the graph shown. Initially, the
Unlock this Answer For Free Now!
View this answer and more for free by performing one of the following actions

Scan the QR code to install the App and get 2 free unlocks

Unlock quizzes for free by uploading documents