Refer to the graph shown. Initially, the market is in equilibrium with price equal to $3 and quantity equal to 100. Government imposes a tax on suppliers of $1 per unit. The effect of the tax is to: 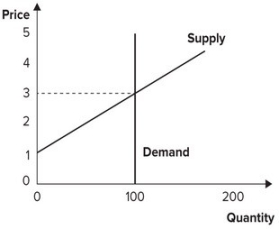
A) raise the price consumers pay from $3 to $4.
B) lower the price consumers pay from $3 to $2.
C) raise the price sellers keep after paying the tax.
D) lower the price sellers keep after paying the tax.
Correct Answer:
Verified
Q68: Refer to the graph shown. Assume the
Q69: Refer to the graph shown. Assume the
Q70: Refer to the graph shown. Assume that
Q71: Refer to the graph shown. Assume the
Q72: If the supply curve is perfectly inelastic,
Q74: Refer to the graph shown. Initially, the
Q75: Refer to the graph shown. Assume that
Q76: Refer to the graph shown. Assume that
Q77: Suppose people freely choose to spend 40
Q78: Refer to the graph shown. Initially, the
Unlock this Answer For Free Now!
View this answer and more for free by performing one of the following actions

Scan the QR code to install the App and get 2 free unlocks

Unlock quizzes for free by uploading documents