Refer to the graph shown. When market supply shifts from S0 to S1, total producer revenue: 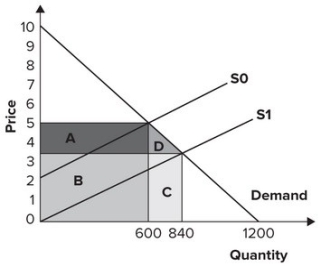
A) increases from $2,520 to $3,000.
B) increases from $1,260 to $1,500.
C) decreases from $3,000 to $2,520.
D) decreases from $1,500 to $1,260.
Correct Answer:
Verified
Q143: Refer to the graph shown. An effective
Q144: Refer to the graph shown. When market
Q145: Refer to the graph shown. With an
Q146: Refer to the graph shown. Initially, the
Q147: Government is lobbied to institute price controls
Q149: Refer to the graph shown. With an
Q150: Refer to the graph shown. After an
Q151: When demand is highly inelastic and supply
Q152: Refer to the graph shown. An effective
Q153: As a result of advances in productivity,
Unlock this Answer For Free Now!
View this answer and more for free by performing one of the following actions

Scan the QR code to install the App and get 2 free unlocks

Unlock quizzes for free by uploading documents