Refer to the graph shown. When market supply shifts from S0 to S1, the revenue gain to suppliers resulting from increased quantity demanded is shown by area: 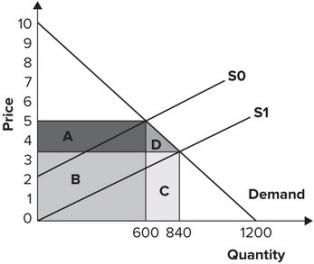
A) A.
B) B.
C) C.
D) D.
Correct Answer:
Verified
Q139: Suppose there are 1,825 taxi medallions in
Q140: Refer to the graph shown. An effective
Q141: Rent-seeking activities:
A) require resources, and the net
Q142: Taxes:
A) cause market shortages.
B) cause the equilibrium
Q143: Refer to the graph shown. An effective
Q145: Refer to the graph shown. With an
Q146: Refer to the graph shown. Initially, the
Q147: Government is lobbied to institute price controls
Q148: Refer to the graph shown. When market
Q149: Refer to the graph shown. With an
Unlock this Answer For Free Now!
View this answer and more for free by performing one of the following actions

Scan the QR code to install the App and get 2 free unlocks

Unlock quizzes for free by uploading documents