Given the graph shown, the quantity that would be associated with the price of $1 in a supply table would be: 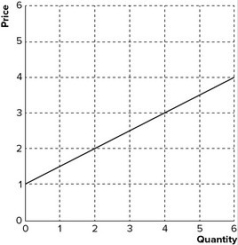
A) 3.
B) 2.
C) 1.
D) 0.
Correct Answer:
Verified
Q91: Refer to the graph shown. Suppose that
Q92: In the early 2000s car sales in
Q93: The following graph shows the supply of
Q94: If the quantity of burgers supplied increases
Q95: The more the current price exceeds the
Q97: Which of the following would best explain
Q98: The supply of leather jackets would be
Q99: Given the following supply table, an increase
Q100: Which of the following is not likely
Q101: Price tends to be in equilibrium where
Unlock this Answer For Free Now!
View this answer and more for free by performing one of the following actions

Scan the QR code to install the App and get 2 free unlocks

Unlock quizzes for free by uploading documents