Refer to the graph shown. Suppose that at a price of $5.00, firm A is willing and able to supply 4 units and firm B is willing and able to supply 4 units. Which of the following statements is then true? 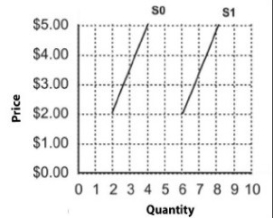
A) Curve S0 shows the quantity supplied of firm A and firm B combined.
B) Curve S1 shows the quantity supplied of firm A and firm B combined.
C) The addition of firm B to the market causes a movement upward and to the right along S0.
D) The addition of firm B to the market causes a movement upward and to the right along S1.
Correct Answer:
Verified
Q86: Which curve shown below represents the
Q87: If the price in a market is
Q88: When the going rate is $10.00 per
Q89: The following graph shows the supply of
Q90: Which of the following would be expected
Q92: In the early 2000s car sales in
Q93: The following graph shows the supply of
Q94: If the quantity of burgers supplied increases
Q95: The more the current price exceeds the
Q96: Given the graph shown, the quantity that
Unlock this Answer For Free Now!
View this answer and more for free by performing one of the following actions

Scan the QR code to install the App and get 2 free unlocks

Unlock quizzes for free by uploading documents